Youth not in employment, education, or training: September 2011 quarter

Available files
The purpose of this article is to provide a brief overview of New Zealand youth (aged 15–24 years) who are not in employment, education, or training (NEET). The statistics in this article are based on Statistics New Zealand’s new official measure of NEET, which uses data from the Household Labour Force Survey (for more information on the NEET indicator, how it is calculated and why it is useful, see Introducing the youth not in employment, education, or training indicator).
Information about youth NEET are of interest due to the possible implications that being NEET may have on their future labour-market experiences. Those youth who are categorised as NEET are considered to be disengaged from both work and education. The youth NEET rate is calculated as the total number of youth who are NEET as a proportion of the total youth-specific working-age population.
Youth NEET data in this article are seasonally adjusted estimates unless otherwise stated.
Latest youth NEET rates show decrease
In the September 2011 quarter compared with the June 2011 quarter, the youth NEET rate decreased by 0.5 percentage points to 12.3 percent. This decrease follows a decrease of 1.6 percentage points in the June 2011 quarter. There were decreases for both men (down 0.6 percentage points) and women (down 0.4 percentage points) over the latest quarter. By five-year age group, the NEET rate decreased for those aged 15–19 (down 0.4 percentage points) and those aged 20–24 (down 0.6 percentage points) during the same period.
Figure 1 (see image attached) shows NEET rates by age group from the March 2004 quarter to the September 2011 quarter.
Youth NEET rates over time
The overall youth NEET rate was relatively stable from the March 2004 quarter to the December 2008 quarter (see figure 1). During this period, the rate was between 10.2 percent and 12.0 percent. The rate increased from the March 2009 quarter, reaching a peak of 15.4 percent in the December 2009 quarter. Following this high, it is now showing signs of returning to pre-2009 levels. By five-year age group, figure 1 shows that NEET rates are higher for those aged 20–24 than for those aged 15–19. This difference is mostly due to the larger number of 15–19-year-olds who are engaged in education.
Youth NEET rates higher for women
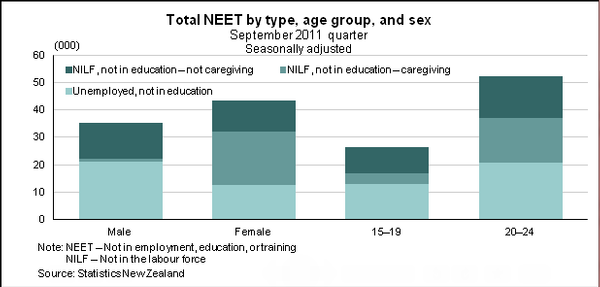
Youth NEET rates are higher for women than for men. For women, the number of NEET who are not in the labour force (NILF) and not in education, but are engaged in caregiving is much more notable than for men. However, there are more male youths unemployed and not in education.
Figure 2 (see image attached) illustrates the above for the number of youth NEET in the September 2011 quarter, by sex and five-year age group. From the graph we can see the different structures of the NEET group depending on what subgroup is being looked at.
New Zealand NEET rate slightly higher than OECD average
With an unadjusted youth NEET rate of 12.5 percent in the June 2011 quarter, New Zealand was just above the Organisation for Economic Co-operation and Development (OECD) average of 12.2 percent. Our NEET rate was higher than Australia (11.4 percent), but lower than the United Kingdom (13.4 percent), the United States (14.8 percent), and Ireland (17.6 percent). Figure 3 shows the latest available NEET rates for OECD countries.
In the June 2008 quarter, New Zealand had a NEET rate of 10.4 percent, which was just lower than the OECD average of 10.7 percent for 2008.
Figure 3 (NEET Rates at Youth aged 15-24)
Youth not in the labour force or education most likely to have no qualifications
Table 1 shows the qualification levels of youth by their combined labour force and education status (this is unadjusted data). The figures show that youth who are not in the labour force and not in education are most likely to have no qualifications. Youth who are employed (whether in education or not) are more likely to have qualifications.
Table 1
|
Youth labour force and education status by highest qualification September 2011 quarter |
||||
| Labour market and education status | Highest qualification | |||
| No qualification | School only | Post-school only |
School & post-school |
|
| Percent | ||||
| Employed, in education | 12.8 | 67.8 | 2.1 | 17.0 |
| Employed, not in education | 16.5 | 36.0 | 5.0 | 40.2 |
| Unemployed, in education | 27.8 | 60.3 | S | 8.7 |
| Not in the labour force, in education | 35.9 | 55.3 | 1.7 | 6.5 |
| Not in employment, education, or training (NEET) | ||||
| Unemployed, not in education | 29.1 | 33.5 | 8.5 | 28.5 |
| Not in the labour force, not in education – caregiving | 43.8 | 24.7 | 10.7 | 18.0 |
| Not in the labour force, not in education – not caregiving | 40.6 | 36.1 | 5.4 | 15.8 |
| Total NEET | 36.4 | 32.0 | 8.1 | 21.9 |
| Total youth aged 15–24 | 25.3 | 49.8 | 3.5 | 20.2 |
|
Symbol: S Suppressed. Estimate used to calculate the percentage is less than 1,000. Source: Statistics New Zealand |
||||
Youth NEET rate highest for Māori
Table 2 shows the labour force and education status of youth by ethnic group (using total response, unadjusted data). A larger proportion of Māori youth were NEET in the September 2011 quarter when compared with other ethnic groups (22.2 percent of all Māori aged 15–24 years). Young Pacific peoples had the second-highest NEET rate at 17.6 percent.
Since the introduction of the new ethnicity measures to the HLFS in the December 2007 quarter, Māori youth have consistently had higher NEET rates than European, Pacific, and Asian youth.
Table 2
|
Youth labour force and education status by total response ethnicity September 2011 quarter |
||||
| Labour market and education status | Ethnic group(1) | |||
| European | Māori | Pacific peoples | Asian | |
| Percent | ||||
| Employed, in education | 24.6 | 11.9 | 9.5 | 16.7 |
| Employed, not in education | 31.0 | 27.9 | 23.1 | 21.6 |
| Unemployed, in education | 4.4 | 4.6 | 5.1 | 4.1 |
| Not in the labour force, in education | 30.2 | 33.3 | 44.5 | 50.1 |
| Not in employment, education, or training (NEET) | ||||
| Unemployed, not in education | 4.1 | 9.2 | 8.8 | 2.8 |
| Not in the labour force, not in education – caregiving | 2.4 | 6.9 | 5.1 | S |
| Not in the labour force, not in education – not caregiving | 3.1 | 6.1 | 3.7 | 3.5 |
| NEET rate | 9.6 | 22.2 | 17.6 | 7.2 |
|
1. Total response measure of ethnicity. An individual may be counted in more than one ethnic group. Symbol: S Suppressed. Estimate used to calculate the percentage is less than 1,000. Source: Statistics New Zealand |
||||
More information
The following tables are included with this article and are available in Excel format. If you do not have access to Excel, you may use the Excel file viewer to view, print, and export the contents of the file.
1. Youth labour force and education status (those aged 15–24) by age group, quarterly, March 2004 to September 2011
2. Youth labour force and education status (those aged 15–24) by age group, quarterly, March 2004 to September 2011, seasonally adjusted series
3. Youth labour force and education status (those aged 15–24) by age group, quarterly, March 2004 to September 2011, trend series
4. Youth NEET rates, by OECD country, 2008, 2010, and 2011
Youth labour force and education status data is now available on Infoshare and will be updated every quarter. For more information on the NEET indicator, how it is calculated and why it is useful, see Introducing the youth not in employment, education, or training indicator.