Red, ripe, and really versatile: tracking tomato prices in the CPI


Household spending on tomatoes
New Zealanders’ taste for buying fresh tomatoes all year round was tested when the average price leapt to $13.25 per kg in July 2011. Although winter peaks commonly happen with tomato prices, this was 52 percent higher than the July 2010 average of $8.70 per kg.
The Household Economic Survey (HES) figures show New Zealand households spent more than $100 million on fresh tomatoes, estimated to represent more than 20,000 tonnes, in the year to June 2010. This was similar to spending on fresh potatoes and on apples. Bananas had the most expenditure of any fruit or vegetable, at more than $140 million. Figures from the HES suggest households buy fewer tomatoes when they are out of season and available at higher prices, and more tomatoes when they are in season and available at lower prices. The result of this is that New Zealanders’ spending on fresh tomatoes actually tends to remain at similar levels throughout the year, whatever the season.
In addition to buying fresh tomatoes directly, households also buy processed tomato products, and prepared meals that include fresh or processed tomatoes as an ingredient at restaurants, cafes, and takeaway outlets. HES and other figures show, in the year to June 2010, New Zealand households spent: more than $40 million on tomato sauce; more than $30 million on pasta sauces; more than $25 million on canned tomatoes; and more than $10 million on tomato pastes and purees.
Fresh tomatoes have featured in the consumers price index (CPI) basket since 1949. They were introduced with an expenditure weight of 1.2 percent of the food group (out of about 60 sampled food items at the time). In the June 2011 quarter, tomatoes had a weight of 1.5 percent within the food group (out of about 160 sampled food items).
Fresh tomatoes had an average retail price of 1 shilling and 1 penny per pound in the March 1949 quarter. That’s about $9.10 per kg in today’s terms, allowing for general food price inflation. By comparison, the weighted average retail price in the March 2011 quarter was $4.40 per kg.
Growing tomatoes in New Zealand
Tomatoes can be grown indoors to a greater height than outdoors. Although the harvested area for tomatoes is significantly smaller for those grown indoors than outdoors, the volume of tomatoes produced is similar. Indoor tomatoes can be grown all year round, while outdoor tomatoes are grown at warmer times of the year in New Zealand. In 2010, the estimated volume of fresh indoor tomatoes produced was about 40,000 tonnes, compared with 50,000 tonnes for outdoor tomatoes (Plant & Food Research and Horticulture New Zealand, 2010). Some of these are bought as fresh tomatoes by consumers, and some are further processed.
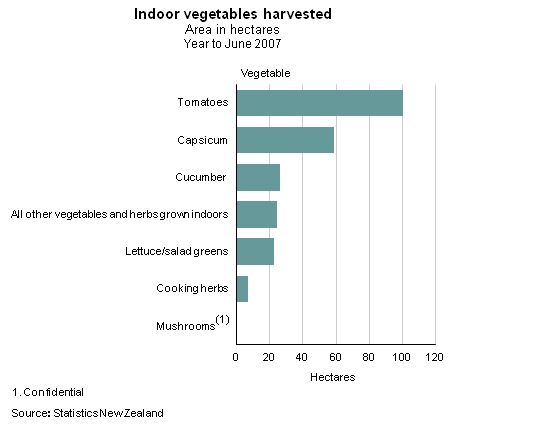
In the year to June 2007, an area of slightly over 1 million square metres (100 hectares) was harvested for indoor tomatoes (Statistics NZ, 2008). (A hectare is about the same size as a rugby field.) Figure 1 shows that tomatoes had the largest area for any indoor vegetable commercially grown in New Zealand in the year to June 2007. The majority (72 percent) of the indoor tomato area in 2007 was in the Auckland and Waikato regions (Statistics NZ, 2008).
Figure 1 Indoor vegetables harvested (see chart)
Outdoor tomatoes had a harvested area of about 760 hectares in the year to June 2007. The majority (55 percent) of the area was in the Hawke’s Bay (Statistics NZ, 2008).
Most of the fresh tomatoes that households buy are grown in New Zealand. In the year to June 2010, the volume of exported fresh tomatoes was around 3,000 tonnes; the volume of imported fresh tomatoes was also around 3,000 tonnes (Statistics NZ, nd). This compares with the estimate of more than 20,000 tonnes purchased by New Zealand households in the year to June 2010.
Processed tomato products in the CPI basket today
The influence of tomatoes on the CPI does not end with freshly-picked tomatoes – we also currently track three processed tomato products in the CPI:
- canned tomatoes
- tomato-based pasta sauce
- tomato sauce.
Tomato sauce retail prices have been tracked since at least 1921. Tomato sauce was tracked in the 1949 CPI basket in a 10oz (283g) bottle. This had an average price of 1 shilling and 6 pence in the March 1949 quarter. That’s about $5.40 in today’s terms, allowing for general food price inflation.
Most tomato sauces we collect prices for now are between 560g and 600g (in both cans and bottles). The weighted average retail price in October 2011 was $3.04 for 560g of sauce. It takes 920g of fresh tomatoes to produce a 575g can of Wattie’s tomato sauce (Heinz Wattie's Ltd, personal communication 16 December 2011).
Of the processed tomato products, canned tomatoes are the newest in the CPI basket. They were introduced in 2006. Tomato-based pasta sauces are the next most-recent addition, having been added in 1999, replacing tomato paste, which had been added in 1993.
New Zealand households also grow their own tomatoes. We track prices of outdoor tomato plants in December quarters only (due to seasonal availability). We also track prices of canned spaghetti (in tomato sauce).
Fresh tomato price movements
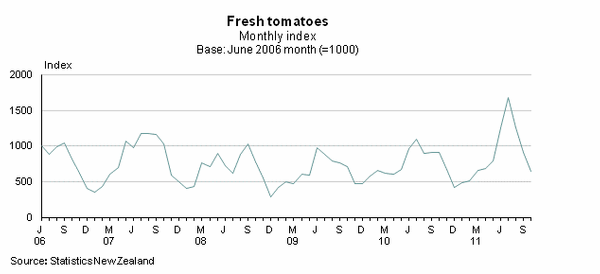
Figure 2 shows the seasonal pattern of fresh tomato retail prices (described in Seasonal price fluctuations for fresh fruit and vegetables, Statistics NZ, 2010). Prices tend to peak in winter, and hit a low in summer. In December 2008, prices fell to an average $2.24 per kg, which appears to have resulted from export restrictions on New Zealand-grown tomatoes. These were put in place in June 2008, following the discovery of a bacterium here. Restrictions included the suspension of tomato exports for a time. Access to the majority of our export markets, which include Australia, the United States, and several Pacific Islands, had been re-established by the start of 2009, with new compliance measures in force, as requested by trading partners (Ministry of Agriculture and Forestry, 2009).
Between December 2010 and July 2011, prices almost quadrupled (going from $3.34 to $13.25 per kg). In late 2010 and early 2011, flooding affected supplies of fruit and vegetables in Queensland (The Australian, 2011). This significantly affected the volume and price of fresh tomatoes imported into New Zealand in the 2011 winter.
Figure 2 Monthly price index for fresh tomatoes (see chart)
Fresh tomato export and import volumes
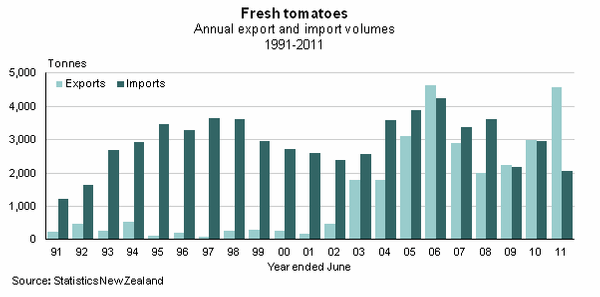
Figure 3 shows the volumes of fresh tomato imports and exports for the years to June 1991 to 2011. From 1991 to 2002, imports were much greater than exports. However, the situation for exports changed in the year to June 2003, when the volume of exports almost quadrupled. An opportunity to export to Australia, our largest trading partner for fresh tomatoes, had always existed in late summer when temperatures get too hot to grow tomatoes in Queensland. In the summer of 2002/03, the period of hot weather was longer than usual (NZ Herald, 2003). In the year to June 2011, the volume exported was more than double the volume imported.
Figure 3 Fresh tomatoes, import and export volumes (see chart)
Processed tomato price changes
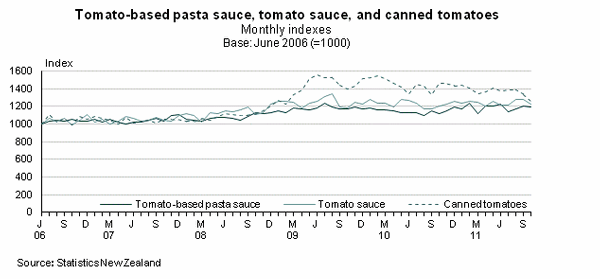
Figure 4 shows price series for the three processed tomato products in the CPI basket between June 2006 and October 2011. Over this time, canned tomatoes had the largest price increase (up 26.1 percent), then tomato sauce (up 22.1 percent), followed by tomato-based pasta sauces (up 18.7 percent). From June 2006 until mid-2008, prices were relatively flat for all three products.
Figure 4 Tomato-based pasta sauce, tomato sauce, and canned tomatoes (see chart)
For the year to June 2009, canned tomato prices increased 39.2 percent; from then until October 2011, prices fell 19.2 percent.
New Zealand imported around 16,000 tonnes of processed tomatoes in the year to June 2010, and exported around 2,000 tonnes.
Italy supplies most of the processed whole (or in pieces) tomatoes imported to New Zealand. In 2008, growers in Italy were offered significantly higher prices (up 60 percent) for tomatoes for processing (Fresh Plaza, 2008). Between 1988 and 2008 the quarterly average import price, including delivery to New Zealand, of processed whole (or in pieces) tomatoes from Italy had usually been between $1.00 and $1.50 per kg. In the March 2009 quarter, this rose to more than $2.00. However, by the December 2009 quarter this fell to around $1.50, and decreased further in 2010.
Tomato sauce prices increased 16.1 percent in the year to August 2009; from then until October 2011, prices fell 9.4 percent. Tomato-based pasta sauce prices increased 15.5 percent in the year to July 2009; from then until October 2011, prices fell 3.6 percent.
Conclusion
Tomatoes’ versatility means they are used in many ways, such as in salads, sandwiches, and on top of pizzas. As a sauce they are used in pasta dishes and on takeaway meals like fish and chips. In keeping with their versatility and popularity, tomatoes are included in the CPI basket in a variety of fresh and processed forms.
References
Fresh Plaza (2008, December 4). Italy leads tomato production with 38%. Available from www.freshplaza.com
Plant & Food Research and Horticulture New Zealand (2010). Fresh facts. Available from www.freshfacts.co.nz
Ministry of Agriculture and Forestry (2009). Farm monitoring report 2009. Available from www.maf.govt.nz
NZ Herald (2003, May 16). Tomato exports surge. Available from www.nzherald.co.nz
Statistics NZ (nd). Infoshare, Imports and exports. Available from www.stats.govt.nz/infoshare
Statistics NZ (2008). Agricultural census tables 2007. Available from www.stats.govt.nz
Statistics NZ (2010). Seasonal price fluctuations for fresh fruit and vegetables. Available from www.stats.govt.nz
The Australian (2011, January 12). Fruit and vegetable prices to soar because of Queensland floods. Available from www.theaustralian.com.au
