The fall and rise of household saving


Households have had a poor saving record in recent years. Statistics New Zealand’s Institutional Sector Accounts show that households have generally spent more money than they earned over the last 20 years, especially since 2001 when the property market was buoyant.
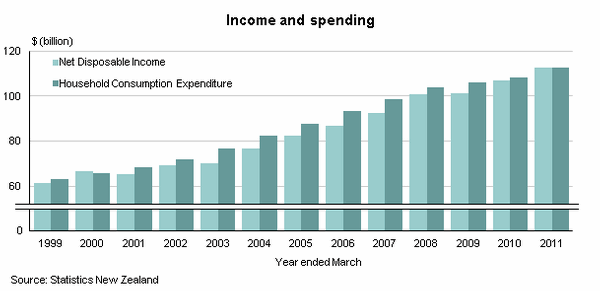
This ‘negative saving’ peaked at -$6.8 billion in the year ended March 2006 or $1,640 per person. Negative saving occurs when income is less than spending on consumer goods and services (for example, food, electrical goods, car repairs). Consumption spending doesn’t include income tax, interest payments, or investments such as buying property.
However, provisional numbers released in the Institutional Sector Accounts before Christmas indicate that households are now back in positive territory, saving $0.2 billion in the March 2011 year. In this article, we examine the evidence from the Statistics New Zealand data that may explain what could have caused the dip into negative saving.
(See Graph: Income and Spending)
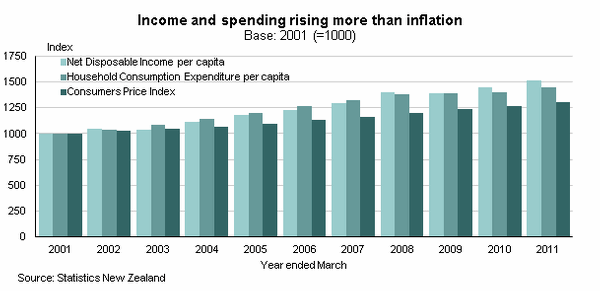
The graph above shows that spending was greater than income from 2001 to 2010 (the difference between the two is negative saving). So, why did we spend more than we earned from 2001 to 2010? Arguments of insufficient income and unmanageable increases in costs of living aren’t supported by statistics. Income per person increased more quickly than inflation, so negative saving doesn’t seem to be because people weren’t earning enough. Spending per person also grew faster than inflation, so we can’t blame the cost of living. It seems households were simply buying more goods and services. The rise in spending outpaced income growth.
(See Graph: Income and Spending rising more than inflation)
Impact of increasing property prices
One possible explanation is that household wealth increased as a result of strong increases in property prices. House prices peaked in the March 2008 year, rising from a trough in 2001. This affected household saving in various ways.
Households spent a lot of money buying houses, both to live in and as rental property investments. As house purchases are treated as investments (rather than as household spending), they don’t affect the overall level of household saving. However, paying mortgage interest reduces the amount that households can save. Total mortgage interest payments increased in the 2000s. The most significant increases occurred from 2005, but saving had already been negative for four years by then. Annual increases in total income of around $4–8 billion from 2002 to 2005 dwarfed mortgage interest increases of up to $0.8 billion.
Households also invested in rental properties. Rental profits can lift household saving. However, over the 2000s the interest and operating costs of the country’s rental properties were greater than the national rental income. Therefore, rental profits did not add to household saving.
Borrowing to spend
With strong growth in spending outpacing rising incomes, it seems households may have chosen to borrow to spend. Statistics from the Reserve Bank of New Zealand (RBNZ) show consumer debt (non-housing debt) and credit card debt rose, although not enough to cover the difference between income and spending. But housing debt rocketed.
Rising property values meant household wealth rose, and having greater equity may have allowed homeowners to convince banks and other lenders to lend them more money. At the same time, households might have felt their rising financial security (and quickly building retirement nest eggs) meant they could afford to ‘bring forward’ some spending. It seems many added to their mortgages to do so.
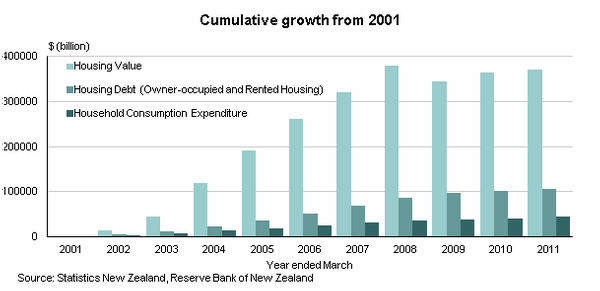
The RBNZ estimated that the total value of housing increased $379 billion from 2001 to 2008, compared with an increase of $87 billion in mortgage debt, $35 billion in extra household spending, and $36 billion in cumulative negative saving. Households appeared to take the opportunity to borrow against their housing equity to maintain and grow their spending.
(See Graph: Cumulative growth from 2001)
Households eventually reigned in spending relative to their income, especially from 2008. They may have chosen to do this or it may have been because it became harder to access credit. The Savings Working Group found household saving rates rose strongly in various countries in the 2008 financial year, around the time of the global credit crunch.
With household saving now tentatively back in positive territory, economists will be waiting to see whether the upward trend in saving will be maintained as the New Zealand economy recovers from recession. Statistics New Zealand will release the next household saving estimate, for the year ending March 2012, towards the end of this year.
