What New Zealand actually does for a living: from manufacturing to a services-oriented economy
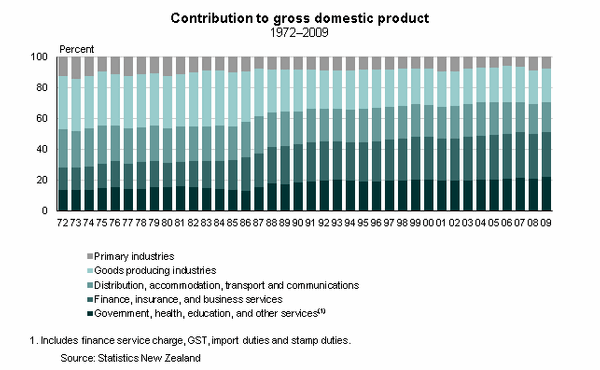
In the early 1970s, New Zealand’s economy was heavily reliant on manufacturing, as was the rest of the industrialised world. More than 30 years on, the picture has changed.
There has been a big shift in the economies of the 34 Organisation of Economic Co-operation and Development (OECD) countries. These economies are now manufacturing fewer goods and providing more services. New Zealand also fits this pattern.
To reflect this change, the international classification standard for industry statistics was updated by the United Nations (UN) Statistics Division. Based on the international standard, Statistics New Zealand and the Australian Bureau of Statistics introduced a new industrial classification. The Australian and New Zealand Standard Industrial Classification 2006 (ANZSIC06) aims to better reflect the structure of industries today and to improve comparability with other countries’ statistics. Last year, Statistics New Zealand started using the ANZSIC06 classification to compile gross domestic product (GDP) statistics.
This article looks at how the contribution that different industries make to GDP has changed since 1972 (the start of the series). We examined how the underlying structure of our economy has changed over time using current prices (not adjusted for inflation).
(See Graph: Contributions to gross domestric product)
Finance, insurance, and business services lead the increase
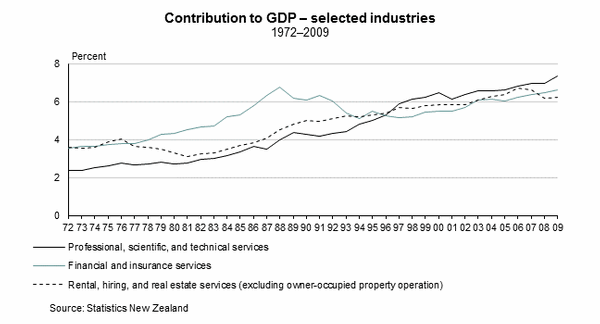
Finance, insurance, and business services’ contribution to GDP has risen the most, moving from 15 percent in 1972 to 29 percent in 2009. This industry, which includes professional, scientific, and technical businesses, steadily increased from 2 percent in 1972 to 7 percent in 2009. The ANZSIC06 classification provides a more detailed breakdown of service industries and highlights their growing importance in the New Zealand economy.
Finance and insurance services’ share of GDP grew consistently from 1972, peaking at 7 percent around the time of the New Zealand share market crash in 1987. Their contribution gradually decreased to 6 percent in 1994 before rising back to 7 percent around the time of the global financial crisis.
The contribution of rental, hiring, and real estate services increased from 4 to 6 percent from 1972 to 2009. Increasing activity in the residential and commercial rental markets contributed to this growth.
(See Graph: Contribution to GDP - selected industries)
Goods producing industries – a big decline, particularly in manufacturing
Goods producing industries are all of the manufacturing, construction, electricity; gas, water supply, and waste management industries.
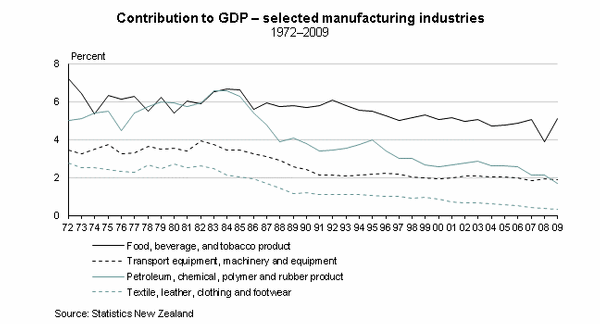
In the 1970s, trade and tariff barriers protected New Zealand manufacturers from foreign competition. In the mid-1980s, the country went through a host of market reforms that threw the economy wide open. As a result, manufacturing steadily declined as a proportion of New Zealand’s GDP. Forty years ago, manufacturing made up 26 percent of GDP. In 2009, this industry made up 13 percent of GDP.
(See Graph: Contribution to GDP - selected manufacturing industries)
Among manufacturers, the biggest drops in contribution were in petroleum, chemical, polymer and rubber product manufacturing (decreasing 3 percent); followed by food, beverage and tobacco product manufacturing (decreasing 2 percent) and textile, leather, clothing and footwear (decreasing 2 percent).
Agriculture declines, while mining activity increases
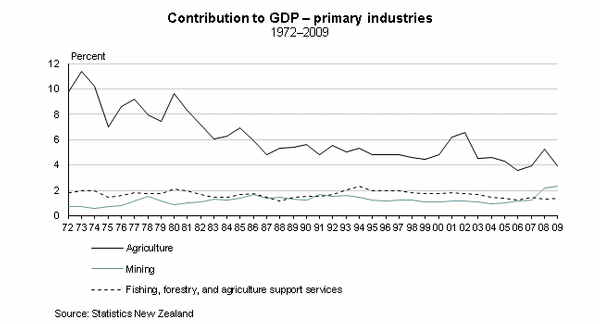
Primary industries’ total contribution to GDP decreased from 12 percent in 1972 to 8 percent in 2009. Primary industries include agriculture, fishing, forestry, and mining.
New Zealand has been promoted as a major world food exporter. Our statistics show that agriculture’s relative contribution to GDP decreased significantly, from 10 percent in 1972 to 4 percent in 2009. However, this decline does not include any downstream effects in related industries such as dairy product manufacturing.
Until the early 1980s, the New Zealand government focused on maximising agricultural production and farmers enjoyed large subsidies. Agriculture’s contribution to GDP peaked in 1973 and 1980, boosted by soaring commodity prices and record sheep and beef exports.
Things changed in 1985, when the government floated the dollar and began phasing out support for agriculture, including fertiliser subsidies and tax concessions. The agriculture industry’s contribution to GDP has been generally declining since then, with the occasional rise. This industry is strongly affected by commodity prices, currency fluctuations, and weather-related events such as droughts.
There has been a rise in activity in the mining industry in recent years. This industry’s contribution to GDP has risen by 1 percent since 2007.
(See Graph: Contribution to GDP - primary industries)
Distribution, accommodation, transport, and communications decreases, while healthcare doubles
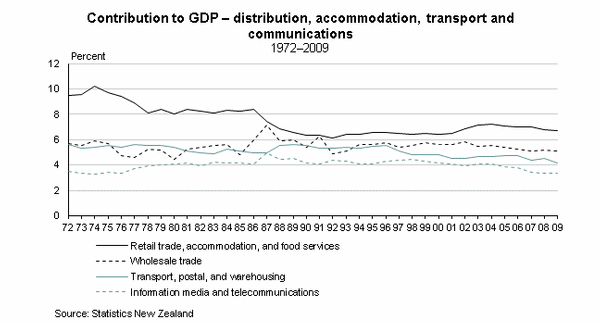
The contribution made by the distribution, accommodation, transport, and communications industries has decreased from 24 percent in 1972 to 19 percent in 2009. The industries that are included here are: retail trade, accommodation and food services (decreased 3 percent), wholesale trade (less than 1 percent decrease), transport, postal, and warehousing (decreased almost 2 percent) and information media and telecommunications (no change).
(See Graph: Contribution to GDP - distribution, accommodation, transport, and communications)
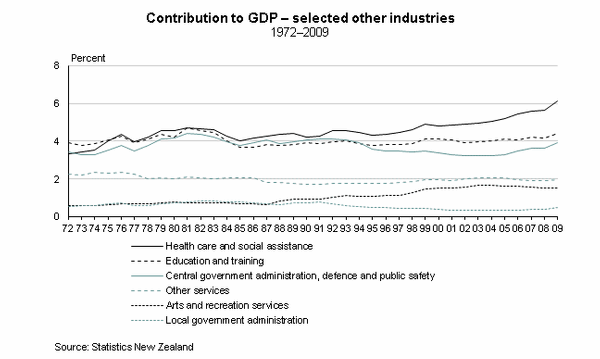
Healthcare and social assistance’s contribution to GDP roughly doubled from 1972 to 2009, from 3 percent to 6 percent. Arts and recreation services’ contribution also increased strongly, beginning in 1988. The ANZSIC06 classification includes government activity in industries based on the services they produce. For example, District Health Boards are included in healthcare and social assistance; and local government-run museums are included in arts and recreation services.
(See Graph: Contribution to GDP - selected other industries)
Conclusion
The structure of the New Zealand economy has changed significantly since 1972. Manufacturing has declined and services now make the biggest contribution to GDP. This mirrors trends in the rest of the OECD and presents new opportunities for New Zealand.
This article is based on statistics from New Zealand’s National Accounts since 1972. The latest National Accounts statistics are available on our website.
