The New Zealand labour market during recession

This article discusses the performance of the New Zealand labour market from 2006 to 2010. This period includes the recession caused by the global financial crisis.
So how did the New Zealand labour market perform over this period? To answer this question, data from Statistics New Zealand’s labour market information releases is analysed, including the Household Labour Force Survey (HLFS), Quarterly Employment Survey (QES), Student Loans and Allowances, Linked Employer-Employee Data (LEED), Labour Cost Index (LCI), and the National Employment Indicator (NEI).
When there is less economic activity (as measured by changes in GDP in volume terms1), less manpower is needed to produce the economy’s goods and services. This can lead to a fall in either hours worked by employees, fewer people employed, or both.
The New Zealand labour market was affected in many ways:
- people worked fewer hours
- the number of jobs available fell
- unemployment rose
- more people went into study
- there were fewer, and smaller, wage rises
- labour market turnover slowed.
Where possible, data referred to in this article has been adjusted to remove both normal seasonal fluctuations and ‘shocks’ to the series. These series are called trend series.
Hours of work first to reflect the recession
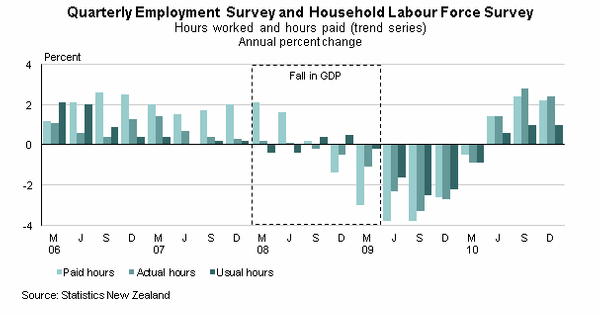
The first visible effect that the recession had on the labour market was that people began to work fewer hours, beginning in mid-2008. Both total hours paid (measured by the QES) and total hours worked (measured by the HFLS) fell during the recession, recording their greatest annual losses in almost 20 years.
During 2008 to 2010, QES total paid hours fell in six consecutive quarters. Similarly, HLFS actual hours worked fell in seven consecutive quarters. A similar fall was also seen in usual hours. Usual hours are traditionally seen as a better indicator of underlying conditions in the labour market than actual hours, during normal economic circumstances.
(See Figure 1: Quarterly Employment Survey and Household Labour Force Survey)
QES paid hours measure the number of hours employers pay employees for. This can include annual leave, sick leave, parental leave, and overtime, but does not include hours worked but not paid. Actual and usual hours from the Household Labour Force Survey (HLFS) measure the number of hours actually worked and usually worked by those who took part in the survey.
Employment falls shortly after falls in hours
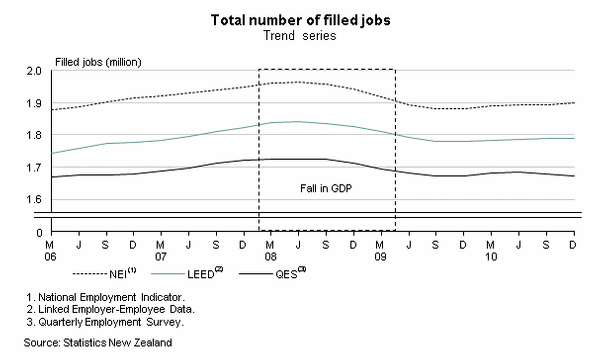
The number of filled jobs in the economy rose steadily up until mid-2008, before falling strongly from mid-2008 to mid-2009. The figure below compares data from the QES, LEED, and the NEI.
(See Figure 2: Total number of filled jobs, trend series)
Differences in the number of filled jobs from each measure are mostly due to different coverage, scope, and measurement. However, each shows a strong fall in late 2008 and early 2009. For more information about comparing employment measures, see comparing our labour market statistics.
The number of people employed (as measured by the HLFS) grew steadily until the September 2007 quarter, at which point employment growth slowed, recovered briefly, then fell sharply over 2009. Employment rose again in 2010, but did not reach its pre-recession levels until early 2011. This rise was largely due to population growth, rather than a rejuvenation of the economy. The proportion of the working-age population employed is still well below the levels seen in 2006 to 2008, suggesting the labour market is yet to fully recover to pre-recession levels.
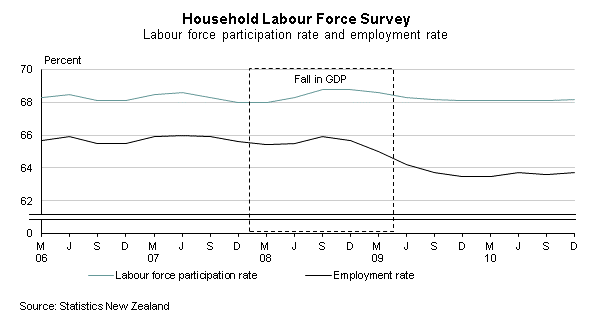
Figure 3 shows how the recession affected the number of people employed as a proportion of the working-age population – the employment rate – and the labour force participation rate. The labour force participation rate is the proportion of people actively engaged in the labour market (those employed and officially unemployed) as a proportion of the working-age population. The labour force participation rate and employment rate provide structural measures of employment and labour market participation.
(See Figure 3: Household Labour Force Survey)
The employment rate reached a peak of 66 percent in the June 2007 quarter, the highest since the series began in 1986. Following the recession, the employment rate suffered its first sustained decline since the late 1990s. From its peak in mid-2007, the employment rate fell 2.5 percentage points to reach 63.5 percent in the December 2009 quarter.
There were also smaller falls in the labour force participation rate. This peaked in the second half of 2008. While employment fell, unemployment rose. People returning to study, retiring, or giving up their job search can influence falls in labour force participation.
Unemployment rises during a recession
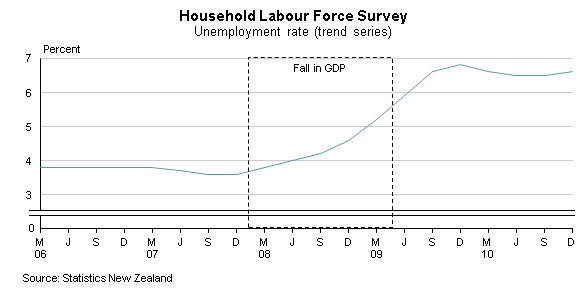
The unemployment rate rose after the global recession hit New Zealand. In the December 2007 quarter, the last quarter before the contraction in real GDP, the unemployment rate was 3.8 percent. Two years later, the unemployment rate had risen to 6.8 percent, the highest rate in over 10 years. The unemployment rate has gradually declined since then, but has yet to fall below 6.0 percent.
(See Figure 4: Household Labour Force Survey (unemployment rate)
The rise in the unemployment rate over this time can be attributed to a combination of factors. In particular, rises in the number of unemployed people in Auckland, rises in the number of unemployed women, rises in the number of unemployed youth, and falls in the number of people working part-time.
While the unemployment rate rose over the recession, we fared better than a number of other countries
During the recession, New Zealand experienced a smaller rise in unemployment than a number of other OECD countries. It is possible to compare New Zealand’s unemployment rate with other countries using the seasonally adjusted harmonised unemployment rate published by the OECD. Over the recession, New Zealand’s unemployment rate rose 1.2 percentage points. During the same period, the unemployment rate rose 3.3 percentage points in the United States, 2.0 percentage points in the United Kingdom, and 1.2 percentage points in Australia.
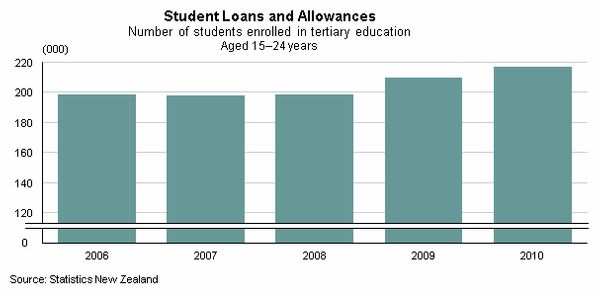
More enrolling in study over the recession
As employment opportunities fell, the number of people enrolled in study rose. In 2008, there were nearly 200,000 students aged 15 to 24 years enrolled at a tertiary institution. Two years later, the number of students in this age group had risen to 216,690, a rise of nearly 10 percent.
(See Figure 5: Student Loans and Allowances)
The worsening labour market also affected the average earnings of students one year after they graduate. Average post-study income fell strongly. Post-study income is likely to have been affected by the type of occupation and industry graduates entered once they finished their study, more graduates being unable to find employment, as well the general weakness of wages being offered across the whole economy.
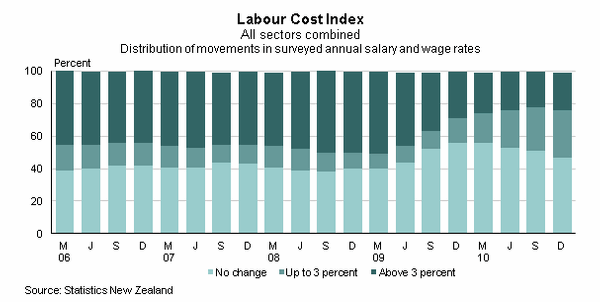
Fewer rises in salary and wage rates following the recession
After the recession, there were fewer rises in salary and wage rates. These rises were also smaller than prior to the recession. In 2006, about 40 percent of salary and ordinary time wage rates surveyed in the Labour Cost Index (LCI) did not increase. In the wake of the recession, this rose to 56 percent of salary and ordinary time wage rates in late 2009 and early 2010.
The percent of salary and ordinary time wage rates that rose by more than 3 percent fell from nearly half of salary and ordinary time wage rate in late 2008 to about a quarter following the recession.
(See Figure 6: Labour Cost Index)
See the Labour Cost Index: December 2011 quarter for more information about annual salary and wage movements.
Labour market dynamics slowed during the recession
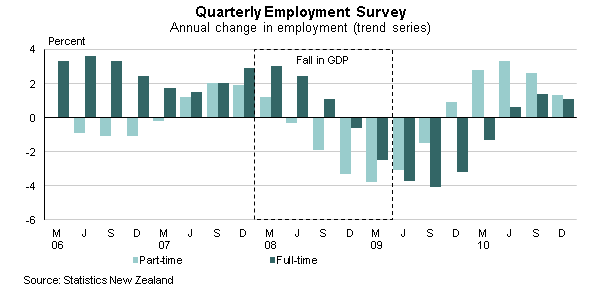
The recession resulted in fewer people in filled jobs, people working fewer hours, and weaker salary and ordinary time wage rates. Employers also reacted to the fall in economic activity by holding onto full-time employees and recruiting fewer new employees. Employees were also less likely to leave their jobs.
While both part-time and full-time employment fell during the recession, part-time employment fell before full-time employment. Part-time employment began falling at the beginning of the recession. Annual changes in QES part-time employment fell for six consecutive quarters from the June 2008 quarter to the September 2009 quarter. QES full-time employment then fell, on an annual basis, from the December 2008 quarter to the March 2010 quarter.
The graph below shows the annual change in the trend series for part-time and full-time employment.
(See Figure 7: Quarterly Employment Survey)
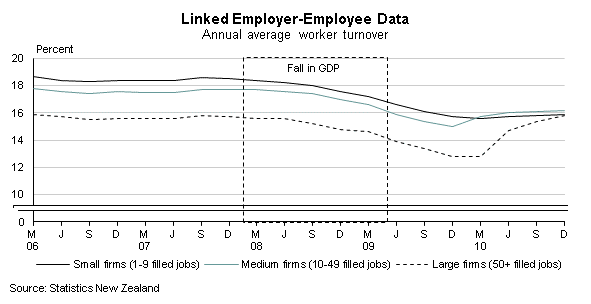
During the recession, employers hired fewer new employees and tried to retain existing staff. Likewise, fewer employees were leaving their jobs. This can be seen in worker turnover rates tracked by Linked Employer-Employee Data (LEED). Worker turnover rates for small, medium, and large firms show that smaller firms were especially affected by the recession.
Worker turnover rates measure the stability of the labour market, or a subset of it, using the number of new employees who are hired (worker accessions) and the number of employees leaving their job (worker separations). A high worker turnover rate indicates a large number of people moving around and in and out of the workforce, whereas a low worker turnover rate indicates greater stability. However, a low worker turnover rate could suggest it is harder for people to move between jobs.
There were large falls in the worker turnover rate for large (50+ filled jobs) and medium (10–49 filled jobs) firms during the recession, and these began to rise again in early 2010. There were also large falls in the worker turnover rate for small firms (1–9 filled jobs) during the recession. Worker turnover rates among these firms have yet to show any substantial rise and are still below pre-recession levels.
(See Figure 8: Linked Employer-Employee Data, worker turnover)
Underpinning the rise in worker turnover for medium and large firms were rises in both new employee hires and employees leaving their jobs. However, this rise in new hires is yet to be seen for small firms.
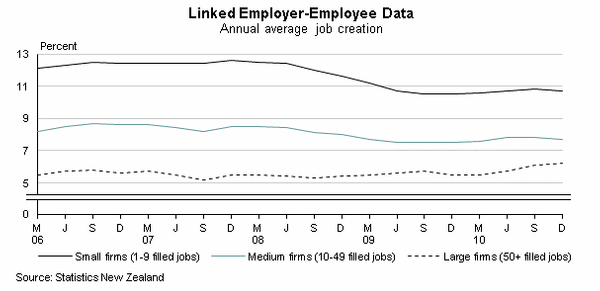
LEED statistics also look at job creation and job destruction, which are complimentary measures to worker turnover measures, and report the net gain or loss of employees for a firm. Looking at the rate of job creation, it is clear that small firms have fared worse more than medium and large firms, and are yet to recover to pre-recession levels.
(See Figure 9: Linked Employer-Employee Data, job creation)
Conclusion
The recession in 2008 and 2009 in New Zealand and the rest of the world continues to affect the New Zealand labour market. There have been falls in employment, falls in hours paid and worked, as well as rises in the number of people unemployed. People have responded by leaving the labour force. In some cases, they have decided to do more tertiary study.
These factors have affected companies to varying degrees, depending on firm size.
The impact of the recession on the New Zealand labour market will continue to be felt for a long time. Statistics New Zealand’s labour market statistics provide a vital measure of the health and performance of the New Zealand labour market.
To access the data used in in this article, go to Infoshare and Table Builder
Use Infoshare, a free, online database to access time-series data specific to your needs. To access the release time series on Infoshare, select the following categories from the homepage:
Subject category: Work Income and Spending
- Group: Household Labour Force Survey – [HLF]
- Group: Labour Cost Index – LCI
- Group: Linked Employer-Employee Dataset - LED
- Group: Earnings and Employment Survey (QES) - QEX
Use TableBuilder, a free, online tool that enables you to extract the information you want. To the release data on Table Builder, select the following tables from the homepage:
Subject category: Employment & Unemployment (Labour Market) Tables
- Table title: Key Labour force measures by qualification, age and sex
- Table title: Filled jobs by ANZSIC Group, Sex and Employment (000s)
- Subject category: LEED quarterly tables
- Table title: Table 6: LEED measures by firm size
Footnote
1. GDP, production measure, seasonally adjusted chain-volume series expressed in 1995/96 dollars.