Not so cut and dried: 60 years of tracking haircut prices in the CPI

This article looks at the different types of haircuts tracked in the consumers price index (CPI) over the past 60 years, their price movements, and the distribution of prices collected in the CPI sample.
Introduction
Haircuts have been included in the New Zealand consumers price index (CPI) basket of goods and services since 1949. Initially, prices were collected for a men’s haircut, a women’s haircut, a women’s hair set, and a women’s permanent wave (perm). The types of haircut we tracked remained unchanged until the 1980 CPI review, when the hair set was dropped and men’s haircuts were separated into wet and dry cuts.
The next big change came in the 2006 CPI review, when the perm was replaced by a women’s hair colouring (cut and colour). Two beauty therapy services – an eyebrow shape and a half leg wax – were also added to the CPI basket in the ‘hairdressing and personal grooming services’ class. Since 2006, price change for this class has been tracked using the following items:
- men's dry haircuts
- men's wet haircuts
- women's haircuts
- women's hair colouring (cut and colour)
- eyebrow shape
- half leg wax.
Haircut prices over the past 60 years
Sixty years ago, in the December 1951 quarter, a women’s haircut would have set you back about 3 shillings in Auckland or Wellington. That’s roughly $8 in today’s terms, after allowing for general CPI inflation from the December 1951 quarter to the December 2011 quarter. A men’s haircut, on the other hand, would have cost about 2 shillings in 1951 or $6 in today’s terms. If you were getting a hair set or a perm in Wellington, they would have cost 5 shillings and sixpence or £1 and 15 shillings respectively – about $15 and $98 in today’s terms.
Thirty years later, in the December 1981 quarter, a women’s haircut cost about $13, or $46 in today’s terms, while a men’s dry cut cost about $4, or $15 in today’s terms.
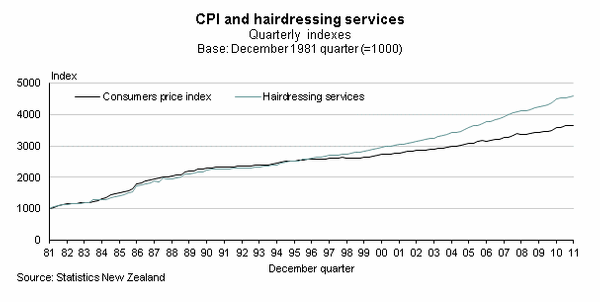
Figure 1 shows how prices for hairdressing services have changed since 1981. Between 1981 and 1995, price change was generally in line with the CPI. From 1995 onwards, haircut prices have risen faster than the CPI. Over the past 30 years, prices for hairdressing services have increased at an average annual rate of 5.2 percent, while the CPI has increased at an average annual rate of 4.4 percent.
(See Figure 1 Graph, CPI and hairdressing services, quarterly indexes, December 1981 to December 2011.
Haircut prices today
The range of hairdressing services available to consumers has expanded over the past 60 years. While some consumers today opt for basic cuts, others choose premium services. Consumers also have a broader range of outlets to choose from – over the past 10 years alone, the number of outlets in the hairdressing and beauty services industry has increased from around 3,000 to 3,900 (Statistics New Zealand, 2012). This presents challenges when collecting prices, as they can vary depending on the type of outlet as well as on the type of services provided.
The types of outlet we collect haircut prices from can influence the average price of the cuts sampled in the CPI. We collect prices from a range of different hairdressers, with barbers also included in the sample for men’s dry cuts. Because of this, the prices collected for each type of haircut reflect a range of hairdressing services instead of one ‘average’ cut.
Of the four types of haircut tracked in the CPI today, the women’s cut and colour is the most expensive, on average. The next most expensive is the women’s haircut, followed by the men’s wet cut. The cheapest is the men’s dry cut.
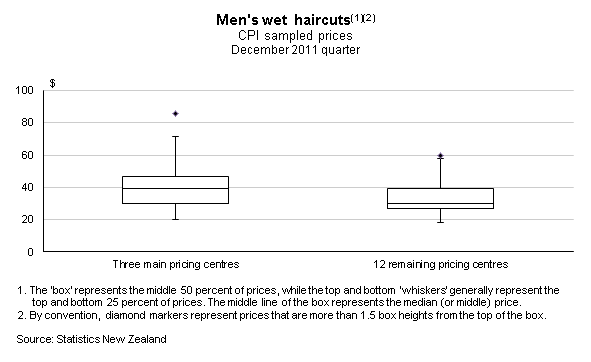
In the December 2011 quarter, the sampled prices for a men’s wet cut ranged from about $18 to $86, with a mean price of about $38. Removing the top and bottom 25 percent of prices shows that the prices collected for the middle 50 percent were between $28 and $42.
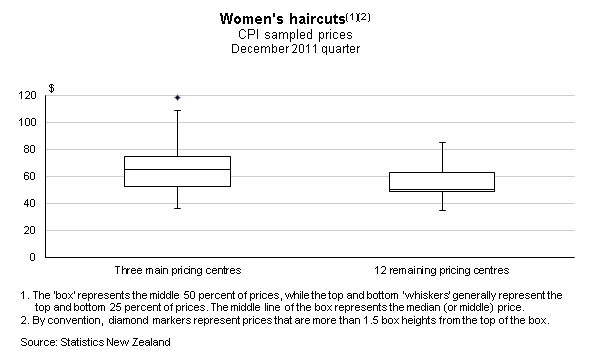
By comparison, the sampled prices for a women’s haircut ranged from about $35 to $118, with a mean price of about $63. Removing the top and bottom 25 percent of prices shows that the middle 50 percent of sampled prices were between $50 and $70.
Regional differences in haircut prices
The range of prices collected also varies between geographical regions. We collect haircut prices in all 15 of the CPI pricing centres, which range in size from Timaru and Wanganui up to Auckland. For both men’s wet cuts and women’s haircuts, the three main pricing centres (Auckland, Wellington, and Christchurch) have a greater range of collected prices compared with the 12 other centres, where prices are more closely bunched. In total, we collect about 70 prices for each type of haircut, with about half of these coming from the three main pricing centres.
For a men’s wet cut in the December 2011 quarter, the prices sampled in the three main pricing centres ranged from about $20 to about $85. Prices in the 12 other centres ranged from about $18 to $60. Taking away the top and bottom 25 percent of prices gives a range of $30 to $46 for the three main pricing centres and about $27 to $39 for the 12 other centres.
Figure 2 shows the range of prices collected for men’s wet cuts, in both the three main and the 12 other pricing centres.
(See Figure 2 Men's Wet Haircuts)
For women’s haircuts, the difference is similar. The prices collected in the three main pricing centres ranged from about $36 to $118. In the 12 other centres prices ranged from about $35 to $85. Taking away the top and bottom 25 percent of prices gives a range of about $53 to $75 for the three main pricing centres and $49 to $63 for the 12 other centres.
Figure 3 shows the range of prices collected for women’s cuts in the three main and the 12 other pricing centres.
(See Figure 3 Women's Haircuts)
Conclusion
Haircuts have been included in the CPI basket for over 60 years. During this time, styles and tastes have changed. The range of hairdressing and personal grooming services in the CPI basket has expanded to reflect these changes – both in the types of haircut included in the basket, and the range of prices collected for each type of cut.
Not so cut and dried gives a pictorial summary of how haircut prices have changed over the past 60 years.
Reference:
Statistics New Zealand (2012). Table builder – business demography statistics, detailed industry by region for geographic units. Available from www.stats.govt.nz.